
Oct 21, 2024
October 21st, 2024
Authors: Jim Stevens
What is Transpiration?
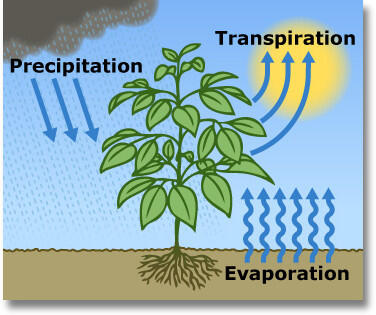
Transpiration is more than just a biological term—it’s the heartbeat of plant physiology, especially within the high-stakes world of Controlled Environment Agriculture (CEA). This essential process allows plants to absorb carbon dioxide (CO2) through tiny openings called stomata during photosynthesis. However, there’s a catch: as these stomata open to let in CO2, they also release water vapor into the atmosphere. This dual action cools the plant but introduces a set of unique challenges for optimizing growth in greenhouses and vertical farms.
While ongoing research delves into the intricate mechanics of stomatal behavior, the physics governing the heat and mass transfer during transpiration is well established. In this blog post, we’ll unravel the fascinating physics behind transpiration and highlight its critical role in temperature regulation, revealing some surprising insights along the way.
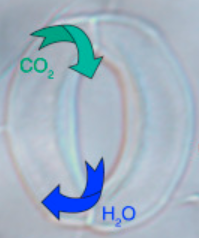
Figure 1: Brightfield image of stoma. From Zhang et al. 2018.
The Physics of Phase Changes: Nature’s Cooling System
When water evaporates from a plant’s surface, it undergoes a phase change from liquid to gas, initiating a cooling effect. This phenomenon occurs because the highest-energy water molecules escape first, leaving behind cooler, lower-energy liquid. However, in line with the first law of thermodynamics, energy cannot simply disappear. The energy facilitating this phase change is transferred to the surrounding atmosphere, resulting in a paradox: as plants cool, the ambient air gains energy.
To truly understand this energy exchange, we must examine the kinetic energy of water molecules. Their varying speeds create a distribution (see Figure 2), where some molecules possess enough energy to break free from the liquid’s surface tension and enter the air as vapour (shaded red).

Figure 2. Maxwell-Boltzmann distribution for water
The Concept of Vapor Pressure: A Delicate Balance
The transition between liquid and vapour is a balancing act. At equilibrium, the number of water molecules escaping the liquid phase equals those returning from the gas phase. This equilibrium tendency is known as vapor pressure.
In the context of CEA, vapor pressure deficit (VPD) is a pivotal concept. VPD represents the difference between current vapor pressure in the air and the maximum vapor pressure possible at a given temperature (at this point the air is saturated). Understanding VPD is essential for plant health; when VPD is high—indicating dry air—stomata close to conserve water, potentially limiting photosynthesis. Hence, maintaining relative humidity levels between 60-80% is crucial in CEA to ensure stomata remain open and operational.
The Energy Balance in Plants: A Thermodynamic Perspective
The energy balance within a plant can be best understood through the lens of thermodynamics. Plants interact with both shortwave (light) and longwave (heat) radiation, leading to the following energy balance equation:
Rn−C−λE=M+S
Where:
- Rn is Net radiation (heat change from long + shortwave radiation from lights and heat emitted from surfaces and the air itself)
- C is the net ‘sensible’ heat loss: the heat lost by convection or conduction. As we will see, this is an important consideration in CEA systems
- λE is the rate of heat loss through evaporation / transpiration, this means the energy required to vaporise water (the Greek letter ‘lambda’ represents the latent heat of vaporisation).
- M is metabolic storage of energy in chemical bonds - mainly we mean photosynthesis & respiration
- S is the net physical storage of heat causing a change in temperature - e.g. of the leaf or soil
How to calculate transpiration
Now we’re pretty much there. By rearrangement, and some simplifying assumptions (M, at about 5% of Rn, is disregarded; as is S because the energy change to heat the small volume of water contained in a leaf is low compared to other changes, and the fraction of heat conducted through the soil is also low in dense canopies), we reduce the energy balance to:
λE = Rn − C
So we’ve now directly linked (evapo)-transpiration in our system to two factors:
- Net radiation and
- Heat loss to convection / conduction
In this system, transpiration (including evaporation from the substrate / soil surface) must exactly balance net radiation less convection / conduction. We’ll leave the details of how to calculate transpiration (and the Penman-Monteith equation which is often used to work it out) for another time. Let’s look at some of the implications of this simple statement of energy balance:
By rearrangement Rn − C − λE = 0.
Starting from this point, and with some assumptions, we can calculate the actual leaf temperature for any combination of radiation, convection and transpiration. Leaf temperature is a critical driver of photosynthesis, with higher temperatures up to some maximum increasing productivity. Yet that heat stress also changes the composition of secondary metabolites that are so important for quality. Consequently, looking at solutions to the equation can show where leaf temperature is higher or lower than preferred. This knowledge is important because it allows you to optimise your HVAC settings, your CO2 inputs or your days to harvest.
Some major caveats
It turns out that convection comprises a substantial component of heat exchange in leaves, and naively it seems obvious that convection (in the form of air movement) would take heat away from the plant. Yet this may not always be the case (Fig. 3).

Figure 3: Predicted leaf temperature for a range of wind speeds and light intensities. Air temp = 25oC, RH =50%.
Now there are some assumptions embedded in this figure: we’ve assumed a 25oC air temperature and 50% relative humidity, smallish leaves and the sort of air flow that it’s reasonable to achieve in CEA (<10ms-1) among other things.
But the inference is clear: if you believe running your fans harder will always cool your leaves, then you are mistaken. At low light intensities, you will end up warming your leaves. In our example here, the tipping point between warming and cooling is about 400 μmol m-2 s-1. Not very bright in a glasshouse context, but probably at the upper end of what’s feasible in a vertical farm.
The model described here is just for the physics of transpiration. We can build ever more complicated models that incorporate the biology: dynamic stomatal resistances, accounting for M and S, different leaf sizes and so on. But I hope this blog has demonstrated how, by using simple equations, we can build complex, counterintuitive behaviour.
Next steps
At Innophyte Consulting, we’d love to hear from you. We have direct experience of working out your environmental control needs based on real-world data, academic literature and sensible assumptions. Plants are not things that engineers are always confident in. And it makes a genuine difference to the economics of your system to get this right. Contact us here for more information or to discuss your needs.